Hi-SimuX RAIL SIMULATION SUIT
Hi-SimuX simulation suite enables user to simulate a transportation system in great detail and flexibility. It is under continuous development with new features as per new needs and developments emerge in the sector.
Hi-SimuX front end interfaces are developed in C# (.NET). Therefore, Hi-SimuX has very user-friendly interfaces, where user can use several tools for easy data input for modelling and interpretation of the results in both tabular and graphical formats. These tools provide very powerful and useful visualisation of all types of data/parameters used in the project.
Hi-SimuX has been used in many projects to assess new operational conditions/rules/vehicles in an existing system as well as designing and/or verification of traction power supply systems of new lines, and it has been confirmed that its results are highly accurate. It is also used in many academic research projects, and was the main source for some publications many of which were in refereed journal/conferences.
Simulation studies have great importance in testing and optimizing of planned systems. If there is going to be a major change (such as reducing headway or replacing old rolling stock with newer ones) in an operational system, simulation studies serve in assessing the impact of this planned change over the existing system. Some of the usage areas of the software are given below:
- Headway analysis and train performance calculations
- Single track operation optimization
- Performance assessment of rolling stock under different operation conditions
- Rolling stock traction package sizing and optimization
- Traction system equipment sizing or adequacy verification
- Catenary/3rd Rail system capacity determination or adequacy verification
- Determination of minimum, maximum and mean_useful voltage values on trains and in zones
- Regenerative braking energy usage
- Rail potential – stray current calculations
- DC side short circuit current calculations
- Comparison of different feeding schemes
- Energy consumption and loss calculations
- Energy efficient driving strategies development and assessment
HI-SIMUX MAIN FEATURES
In simulation of transportation systems, there are hundreds of parameters to be entered into the model by the user in order to have a satisfactory result. Some of the simulation inputs are given below.
- Line number, names, length, stations and dwell times
- Curves, gradients, speed limits and maximum operation speed
- Depots
- Train types on the line (starting and end position, stations, car number, headway time)
- Transformer number, names, positions, section insulators, catenary and rail data
- Vehicle length, weight, traction power, maximum acceleration and deceleration
All system parameters and objects are introduced to the simulation model via an extremely user-friendly graphic interface. These parameters and objects are shown on a line representation graphic in a horizontally scaled fashion.
Hi-SimuX allows the users to use different type of rolling stocks and shows the trains on lines dynamically updating their positions, and allows the users to view any parameters’ change in time as the simulation runs. It is also possible for users to create fault conditions while the simulation runs.
A sample line representation and a zoomed in section of another line representation are given in below. All items on the representation are dynamic and can be interfaced with the right and left button clicks of a mouse.

Line Representation and Some Components in Zoomed-in View
Hi-SimuX provides highly interactive user interface for these parameters. This function eases the creation of the correct model, and helps the designer in optimising the system with respect to changes at these parameters. All the input data entered with menu driven pop-up windows. However, the user can also transfer the data from/to Notepad or Excel in plain text or in XML format. Data exchange with some of the scientific programs such as MATLAB™ and Mathematica™ is also possible.
Unlike most competing products, Hi-SimuX’s dynamic simulation algorithms model the interaction – during each simulation time step – of trains and the power system as conditions change along the alignment. Voltage variation at the train affects train performance, so when the voltage decreases, the acceleration, velocity and location of the train are altered. Power drawn by the train decreases, enabling the traction power system to partially recover from the voltage sag.
Hi-SimuX details the performance loss caused by low voltages by using this algorithm. It can analyse the impacts of a train bunching on the traction power system and the ability of the traction power supply system to support multiple “stacked” trains restarting.
Hi-SimuX supports the assessment of future operating plans in terms of on-time performance predictions, energy usage, vehicle requirements, and the ability of the traction power system to support the proposed train service level under “normal” and “contingency” operations.
Combined with under voltage behaviour modelling, its ability to model VLD (voltage limiting devices attached to the return circuit-running rail) enables us to find achievable headway time under the worst case scenarios such as failing two neighbouring substations.
With support for multiple train types, train consists, Hi-SimuX supports the development and optimization of integrated operating plans.
With these powerful dynamic simulation algorithms, Hi-SimuX avoids over sizing of the system, ensuring that simulation-based capital investment decisions are the right ones.
HI-SIMUX APPLICATIONS
Hi-SimuX supports a wide range of analyses, ranging from conceptual planning exercises to detailed engineering design work. Some of the main Hi-SimuX applications in the planning and design areas are described below.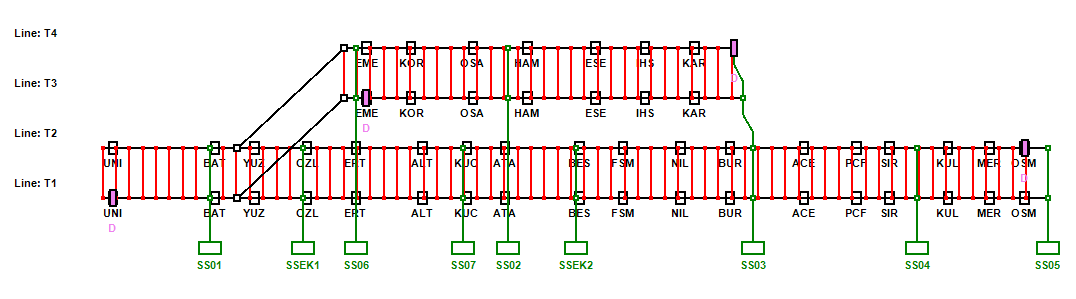
An existing line with branching extension. Visualisation of the model is very high. Line and fixed installations are seen in scaled fashion.
OPTIMUM TRACTION POWER SUPPLY DESIGN
For new and expanding systems, Hi-SimuX supports the detailed analyses needed to generate the most cost-effective designs, while ensuring operability under normal and degraded and emergency conditions. Outputs include substation instantaneous and RMS power, with RMS values available over various user-selected time windows.
A few other Hi-SimuX outputs supporting the traction power design process include:- Train voltage levels,
- Feeder instantaneous and RMS currents,
- Running rail voltage rise (“touch potential”) with respect to ground and stray currents
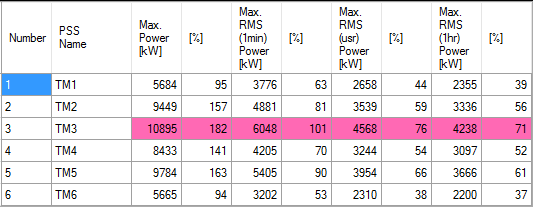
Peak and RMS power loading for each substation in the system, compared with 100% nameplate ratings, allow visual information that all substations are properly sized for a new or reconfigured network.

Lowest train voltages values profile along a heavy metro line.

Highest rail voltage values profile along a heavy metro line.
Traction power systems designed and constructed long ago may require an upgrading, but what would be the most cost-effective capital investment plan? Hi-SimuX modelling can determine whether existing substations, OCS/third rail and power cables are adequate or whether some enhancements are required, particularly as service is increased and new vehicles are introduced. A thorough analysis supported by Hi-SimuX will reveal the rail system’s strengths and weaknesses, allowing for an integrated and updated new design.

Total traction power demand (in green) and its RMS diagram (in red) for a metro line.
Hi-SimuX supports rapid investigation of potential solutions to traction power performance issues – adding a substation, adding paralleling cables, adding feeder wires to catenary system, changing substation “no load” voltages, upgrading the running rails, third rail/catenary or negative return system, or even altering the train schedule (headway or train length or altering maximum speed limits).

Total traction power demand RMS diagram for a day operation of a heavy metro line
Protection settings of a traction power supply system circuit breakers has utmost importance for safe operation of the system. Hi-SimuX can model short circuits on the line and allows us to determine close and remote short circuit current values. This will provide guidance for magnetic trip set value. Hi-SimuX can also provide assistance in determination of relay settings values for inverse-time characteristic over-current protections. Below table gives suggested 2 stages of over-current setting values and durations for a line feeder circuit breaker for both normal and reverse directions.
ROLLING STOCK PROCUREMENT
There is a trade-off of train weight and power. What’s the optimal point for it? Can the rolling stock meet the planned trip time? What happens if an additional vehicle is added to train? Hi-SimuX’ vehicle library and flexibility in creating and editing new vehicle models support these analyses.

Hi-SimuX features detailed vehicle libraries, as well as the ability to add customized models.
PERFORMANCE ASSESSMENT UNDER WORST/WEAKENED SYSTEM CONDITIONS
With detailed modelling of rail system components and algorithms, Hi-SimuX can determine if a train has the right power ratio to climb a grade and to make that advertised trip time.

Velocity diagrams show different simulated tram vehicles struggling to speed up on a steep gradient under failed transformer substation condition
REGENERATIVE BRAKING ENERGY RECUPERATION STUDIES
Regenerative braking function in trains is almost common function. However, industry keeps searching alternative technologies for unused part of the regenerated energy by the braking trains.
How can system and vehicle characteristics be optimized to maximize the electrical energy being returned to the system through braking? Hi-SimuX’s sophisticated algorithms support the optimization process to reduce the carbon footprint of electrified rail networks and optimize their energy saving and energy recovery characteristics.
Hi-SimuX calculates energy consumption dynamically during simulation. Graph shows unused part of regenerated energy and its concentration along a line, which gives idea where to locate wayside energy storage devices
OPTIMIZING ALIGNMENTS AND LAYOUTS
For new systems and system extensions, the planning process can produce an overwhelming number of alignment alternatives. Which alignment produces the best optimization between trip time and energy-efficient operation? Hi-SimuX’s rapid modelling capabilities, including the ability to import alignment information from external data sources, allow fast turn-around in simulating all of the alternatives.
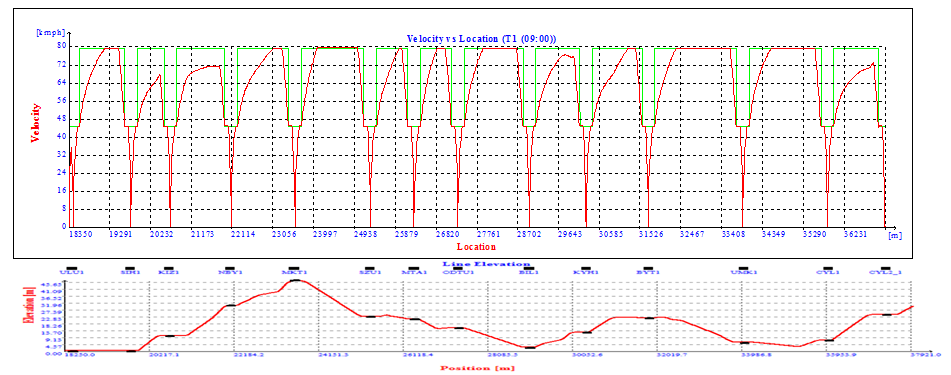
Upper part of the figure shows velocity profile of a metro train and speed limits it obeys along the line. Lower part shows line gradients and stations along the line.

Obtained train graph for a main line.
ENERGY EFFICIENCY STRATEGIES – ECO DRIVING AND OTHER METHODS
Increasing demand for greener operation is the driving force for searching better algorithms giving the most energy saving. Hi-SimuX can model many strategies and asses their fitness.

Hi-SimuX calculates energy consumption and travel time against different coasting start points. It can be plugged into Artificial Neural Networks and Genetic Algorithms for very detailed optimization problems.
A DMU set travelling for 5.2 km on a line. The first graph shows track vertical alignment, and the following two graphs show all-out operation velocity profiles against time and location.


T=05:10 E=53.84 kWh TTimetable=6 min.
Velocity profiles for an eco-driving scenario where Coasting starts at KM 60+272 are given below.


T=06:04 E=22.53 kWh TCoast=02:52
Please observe that extra information is given underneath of each figure.
TRAIN OPERATION AND PERFORMANCE ANALYSIS
Detailed modelling of line, train and signalling characteristics and more realistic examination of end-of-line turns, examining how the train operation will be affected in emergencies and the effect of possible changes in the system on the signalling system can be examined independently from the traction power system.